Introduction
At Drawing Capital, we believe that disruptive and transformative innovation fuels future growth. Several software companies are increasing societal efficiency, integrating technology in our everyday lives, and digitizing both the tech industry and traditionally non-digital industries. We are optimistic about the future of software and its applications for consumers and companies.
In this newsletter, we enable you to learn more about the following 3 topics:
- Historical returns from investing in software and technology
- Sample ETFs to track software, internet, and cloud computing companies
- 12 popular software metrics that are useful for both investors and builders of software companies to evaluate and assess future business prospects.
Historical Returns
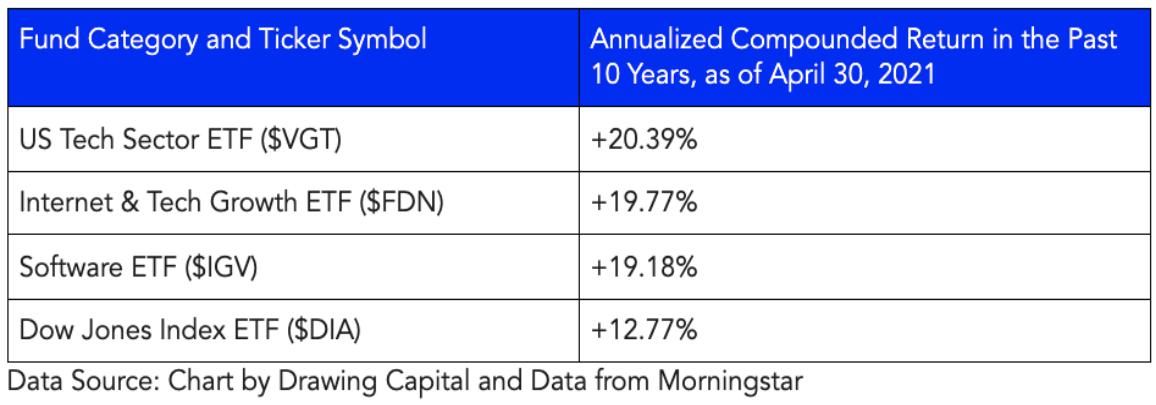
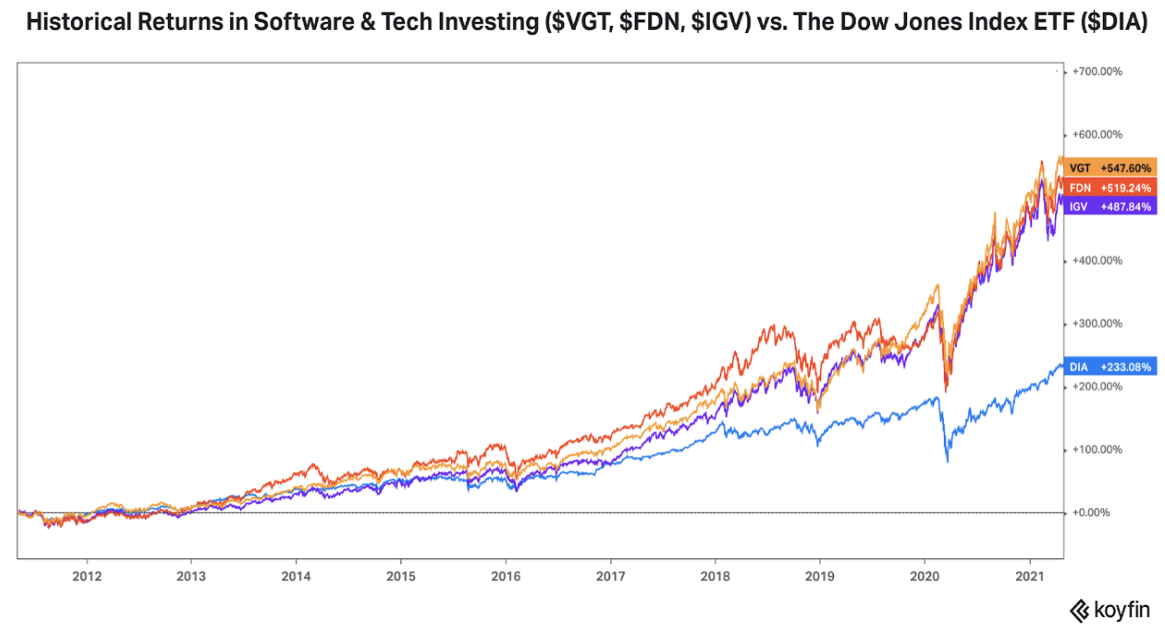
Clearly, software and technology index funds have delivered significantly higher historical performance compared to the Dow Jones Industrial Average Index over the past 10 years.
Important Software Metrics
Software investing is all about growth investing, and as a result, most startups and publicly traded software & cloud companies are valued based on their revenue, future revenue growth rates, and durability of future revenue growth rates. As a result, metrics related to revenue are near the top of the list for software metrics.
In this section, we empower you to understand 12 popular software metrics that are useful as either an investor or builder of software and cloud companies. Ultimately, how can you increase the value of your software company by using these 12 software metrics?
1) Revenue Growth Rate
This metric answers the question: “How fast is this company growing?”
This metric calculated as (Revenue in Time Period 2 / Revenue in Time Period 1) -1
Higher revenue growth rate typically leads to higher price multiples, and higher price multiples implies a higher market cap, which implies a higher enterprise value.
2) Growth Endurance
Growth endurance helps answer the question, “how durable is a company’s revenue growth?”
Growth Endurance = Current Year’s Revenue Growth Rate / Last Year’s Revenue Growth Rate
High growth endurance and predictability of revenues are positive indicators that typically lead to higher enterprise values.
Best-in-class companies typically have growth endurance that exceed 75%.
An endurance of <100% illustrates a decaying growth rate while >100% shows acceleration in revenue growth.
3) Enterprise Value / Revenue
Enterprise Value = Market Cap + Debt – Cash
Past revenue can be found on a company’s income statements. Future revenue projections can be estimated using industry analysis, statistical extrapolation, and/or publicly available equity research estimates from major investment banks and equity research firms.
EV / Revenue is a common price multiple to quickly compare across similar companies.
Companies with high revenue growth rates typically have higher EV/Revenue price multiples compared to companies with low revenue growth rates. A higher EV/Revenue price multiple indicates a higher enterprise value for the same amount of revenue or a lower amount of revenue for the same enterprise value.
4) Bessemer’s Cash Conversion Score
This metric by Bessemer Venture Partners helps to answer the following questions, “what is the return on invested capital, is the company capital-efficient relative to its recurring revenue amount, and is an investor paying a reasonable entry valuation in hopes of generating a favorable investment return?”
Bessemer’s Cash Conversion Score = Annual Recurring Revenue / (Total Equity and Debt Fundraising Amount – Cash)
A higher cash conversion score is better. Best-in-class metrics from Bessemer Venture Partners suggest that a cash conversion score of 1.0 or higher is ideal for generating favorable investment returns for venture capitalists in private software companies.
5) Gross Margin
Gross Margin = (Revenue – Cost of Goods Sold) / Revenue
Gross Profit = Revenue – Cost of Goods Sold
The higher the gross margin, the more the company has to invest and spend in product development, R&D, employee compensation & benefits, sales & marketing, acquisitions, and cash return programs to shareholders (ie. dividends and share buybacks).
A company with a negative gross margin without corrective action is a money-losing enterprise with poor unit economics.
For many cloud and software companies, there are 4 major sources for the cost of goods sold. They are customer success costs, licensing costs for bundled product re-reselling, professional consulting servicing costs, and costs paid to cloud service providers (ie. paid to Amazon’s AWS, Alphabet’s Google Cloud, Microsoft Azure, etc)
Within the same industry, having a consistently higher gross margin is a competitive business advantage.
6) Contribution Margin
This metric answers the question, “how much does the company keep after paying the expenses associated with making the product and selling the product?
Contribution Margin = (Revenue – Variable Costs) / Revenue
Contribution Margin in Dollars = Revenue – Variable Costs
A company with negative contribution margin without corrective action is a money-losing enterprise with poor unit economics.
Low variable costs in producing revenue is a competitive business advantage and leads to a higher contribution margin, which creates higher operating leverage, which leads to higher percentage increases in operating income from smaller percentage increases in revenue, which allows companies to expand and scale worldwide.
Compared to gross margin, which focuses on the total cost of goods sold, contribution margin zooms in specifically on the variable cost and ignores fixed costs. This provides a more specific measurement of scalability of unit economics.
7) Cash Flow Margin
Operating Cash Flow Margin = Operating Cash Flow / Revenue
A higher cash flow margin allows a company to reinvest this cash flow into growing the company, expanding product offerings, engaging in acquisitions, or delivering this cash to shareholders.
One method of gamifying cash flow is to incentivize customers to prepay contracts up-front. While slightly less revenue is generated due to price discounting associated with pre-paid up-front contracts, prepaid contracts provide interest-free loan financing from the customer to the company and therefore improves the cash conversion cycle.
From the perspective of founding and building companies, low or negative cash flow implies more necessity for equity and debt financing in order to survive, sustain, and grow the company. Notably, equity financing and convertible debt create percentage ownership dilution for existing shareholders.
An upward trending cash flow margin is favorable for creating a higher enterprise value over time.
8) Rule of 40
Rule of 40 = Revenue Growth Rate + Free Cash Flow Margin
Ideally, the “Rule of 40” calculation for a software company should exceed 40%.
The Rule of 40 helps to balance revenue growth rate with having positive unit economics for a business.
It’s relatively easy to sell a $100 bill for $80 in order to show high revenue growth, but this type of negative profitability is not sustainable for a business. It’s important for investors and company executives to balance both revenue growth and unit economics.
There are multiple methods for companies in achieving a favorable “Rule of 40” score. For example, a company can have an exceptionally high revenue growth rate with weak free cash flow margins, or a company can have mediocre revenue growth rates but be very profitable.
Higher “Rule of 40” scores typically lead to higher enterprise values for these companies.
9) Net Dollar Retention (NDR)
NDR answers the questions, “what is the automatic revenue growth from existing customers, and are existing customers finding enough value from the product that they are buying more over time?
NDR = cohort value today / cohort value from last year
In the NDR equation, “value” can be defined as either revenue or cash flow.
Methods of improving NDR include product upselling and cross-selling opportunities, understanding price elasticity, generating effective pricing strategies and adjustments, creating flywheel effects with additional product and service offerings, improving customer success teams to better retain customers, tracking customer segmentation and cohort analysis, and both anticipating and solving customer pain points.
The top decile of software companies typically has NDR that is 120%+.
NDR is also a monetary method of measuring customer satisfaction associated with the company’s products and sales processes: if a customer is happy, they have a higher likelihood of buying more products over time.
10) Net Promoter Score (NPS)
NPS answers the questions, “how happy are customers, and how likely is a customer to refer others to a company’s product or service?”
When a customer receives a survey, there is often a score ranking from 0-10. NPS = Percentage of Customer Responses That Were 9 or 10 – Percentage of Customer Responses That Were 6 or Below.
Customers that provide a score of 9 or 10 are considered “company promoters”.
Customers that provide a score of 6 or below are considered “company detractors”.
A high NPS is good for a company and highlights that customers are happy with the product and service quality of a company.
Often, a high NPS should be accompanied by high NDR.
11) Sales Efficiency
- Sales efficiency answers the questions, “how efficient is a company’s spending on sales & marketing in generating more revenue and growing the business, and for every $1 that is spent on sales & marketing, how many friends does that $1 bill come back with in terms of gross profit?”
- Sales Efficiency = Gross Profit in Time Period 2 – Gross Profit in Time Period 1) / Sales and Marketing Expenses in Period 1
- A high sales efficiency is often indicative of either a best-in-category product, an innovative or efficient distribution channel, or both. This metric is a competitive business advantage and serves as a multiplier in generating more revenue for the company.
- A high sales efficiency allows a company to be more capital efficient. Startups that fundraise VC dollars for the sole purpose of financing marketing expenses simply incur an expensive form of equity dilution. Said differently, was a marketing campaign worth 5% of a company?
- Best-in-category products often require little product marketing since they are “bought, not sold”.
- There are 5 common types of sales distribution channels:
- B2C: Company sells directly to a customer. Examples: Spotify, Netflix
- B2G: Company sells directly to governments, either through a SaaS platform or as a software consulting service. Examples: Palantir Technologies, Tyler Technologies
- Top-Down B2B: Company sells directly to enterprise customers by engaging with senior buying individuals at the buying enterprise. Examples: Snowflake, Oracle
- Bottom-Up B2B: Company promotes adoption of the end-users inside enterprises, and once the product reaches a critical mass of adoption, senior buying individuals can choose to purchase more licenses. Examples: Slack, Atlassian
- Developer-Focused B2B: Company promotes adoption of their products and services by developers inside enterprises. Developers have a voice in the products and services that are used on a daily basis as opposed to an autocratic decision made by a Chief Technology Officer or VP of Engineering. Examples: Github, Twilio
- Partnership-Based B2B: Company creates partnerships with management consulting firms (ie. Boston Consulting Group, Deloitte, Accenture, Bain, McKinsey, etc.) that leverage a company’s products in the recommended deployed solution to the buying enterprise. Examples: UiPath, Salesforce
12) Payback Period
Payback period answers the question, “how many months will it take to cover and fully offset customer acquisition costs?”
Payback Period in Months = 1 / Sales Efficiency * 12
A lower payback period is better. Ideally, top quartile software companies have payback periods of less than 24 months.
A high payback period indicates that a company either has high customer acquisition costs, is building a product without significant customer demand, is underpricing its product, is fiercely competing in a competitive market, is fiercely determined to grow at scale in order to cover fixed costs and compete with large incumbents, and/or is experiencing poor sales efficiency in converting sales & marketing expenses into gross profit.
5 Key Insights
- Understanding important software metrics is useful for both investors and builders of software companies. Both investors and builders of software companies are aligned in that both are seeking high revenue growth that eventually commands dominant market share and significant enterprise value creation.
- Often, revenue is a primary contributor to the valuations of software companies: How much is the revenue, how fast is the revenue growing, and how predictable is this revenue?
- Investors can use these software metrics to evaluate and invest in their view of high-quality software companies. Builders of software companies can use these metrics to benchmark their results, understand what’s important for investors (useful in increasing shareholder value and fundraising for additional capital), and find areas of improvement.
- Cloud computing and software companies in aggregate have historically delivered extraordinarily positive returns over time that have also significantly outperformed popular US market indices such as the Dow Jones Industrial Average and the S&P 500.
- In gaining exposure to software companies, investors can either do the hard work of individually picking and choosing to invest in individual software companies, contact Drawing Capital to learn more about Drawing Capital’s software investing approach, rely on experts, or utilize software and cloud focused ETFs such as $FDN, $IGV, or $WCLD.
Summary
Disruptive and transformative innovation fuels future growth. Given the necessity of digital transformation for companies due to the coronavirus pandemic and the right-sizing of business models to lower costs, grow revenues, and expand margins, software and cloud computing are certainly in vogue.
Overall, we’re attracted to the creativity of new technologies and remain committed to seeking multi-period growth opportunities with a tech-focused lens that enables scalable growth. The growth of software and its multi-industry applications have been remarkable, and we expect the digitization of traditionally non-digital industries to continue for the foreseeable future.
References:
- “Trailing Returns – XNAS | Morningstar.” https://www.morningstar.com/etfs/bats/igv/performance. Accessed 1 May 2021.
- “Cash Conversion Score for cloud companies · Bessemer Venture ….” 27 Nov. 2019, https://www.bvp.com/atlas/cash-conversion-score. Accessed 4 May. 2021.
- “Koyfin.” https://app.koyfin.com/. Accessed 4 May. 2021.
This was originally posted on Drawing Capital’s site.